- difficult access to hard financial data of firms,
- no uniform definition of collaborative networks,
- difficulties in determining synergy effects (in assessing the efficiency, indicators reflecting synergy effects produced within a network must be taken into consideration), and
- a question whether the analysis should cover the performance of individual member firms or the whole network.
The last reason seems to be particularly important, having regard to the fact that the analysis of the whole network can be difficult (or even impossible) because networks frequently do not form separate, (in legal terms), business entities. In this matter certain examples of research approaches can be discussed. For example, the approach of P. Ingram and T. Simons (Ingram&&Simos, 2002), who believe that the main measure of a network is profitability compared to other companies from outside the network. The above-mentioned comparison is very difficult to undertake and needs a lot of time because it requires data from the whole sector. Another difficulty is the question of how far the firm’s performance results from the membership of the network and how far from independent operation. B. Kogut in turn emphasizes that individual networks can positively influence the performance of its members, proportionately to the scope and amount of information contributed to the group (Kogut, 2000, pp.406–407).
Afuah believes that the firm’s – part of a network – performance will not always be good, especially when technology develops rapidly and the network fails to keep up with the developments (Afuah, 2000, pp.387–404). Given these findings, the aim of the article is to present the grounds for researching the business network efficiency. The author has adopted the following assumptions:
- the efficiency assessment of business network needs a multi-level approach which reflects the complexity of economic relationships formed in them,
- the business network efficiency evaluation should be based on efficiency measures/criteria relating to the achievement of goals in the organisation as a whole, within a coherent efficiency system.
2. Network efficiency assessment – selected approaches
The concept Task Performance Benefits by Luis M. Camarinha-Matos
This concept treats benefits as abstract and measurable values. The effects of actions taken can be:
Table 1. Types of benefits from collaborative networks
|
Self-benefits (KW) – achieved by the pi enterprise as a result of performing the zi task, within the total number of independent L tasks and the total number of dependent M tasks |
|
|
Received Benefits (KO) – Achieved by the pi enterprise when the pi enterprise performs the zi task (perspective of the pi enterprise) |
|
|
Contributed Benefits (KD) – benefits from the pj enterprise to the pi enterprise as a result of the performance of the zi task (perspective of the pj enterprise) |
|
Source: own study based on (Camarinha-Matos, Abreu, 2007, p.600).
In the structural approach the performance of a firm in a network depends on its structure understood as a degree of embeddedness in the network. The main author and advocate of this concept, M. Granovetter, claims that all forms of exchange contain elements of networks, markets and hierarchy (Granovetter, 1985).
- high – where member firms are connected not only with the central firm but also with each other,
- low – where firms are connected only with the central firm and occasionally with individual entities.
An approach referring to resource diversity
- partners of different capabilities and potential originate usually from outside the central firm, which results in high search costs. Additionally, the risk of adverse selection and engaging firm into ineffective partnerships rises and the costs of leaving the partnership can be relatively high with the process itself being time-consuming,
- establishing another relationship entails higher organisation costs than in the case of existing relationships,
- with growing diversity of a network, its management is prone to administer the network the same as it did previously, failing to take into account the fact that it is the lack of adequate knowledge and resources that increases the risk of wrong decisions.
- gaining better financial results compared to traditional solutions which is an effect of eliminating the costs of organisational hierarchy, increased flexibility of operation, elimination of competition costs in relation to current partners, better allocation of investment capital, reduction of the costs of control and bureaucracy, costs of negotiation, specialisation of operation, better tying up of the customers to the network owing to the opportunity to offer comprehensive services, etc.,
- the complementarity of resources and competences within the network – the network of relations between the partners is beneficial to the exchange and joint use of scarce competences and resources,
- quick exchange of information through horizontal information and communication channels connecting the network contributes to boosting the speed and accuracy of decisions made, increasing the competitiveness and mutual learning,
- opportunity to acquire new knowledge and increase development potential,
- wide autonomy of individual partners which contributes to the innovativeness and learning, and joint coordination of operations and fulfilment of orders permits the flexible use of production capacity of participating enterprises,
- higher efficiency of operation results, among others, from the elimination of hierarchical relations (or their considerable weakening), multi-lateral information and communication connections, better application of the capacity to operate and competences, increased innovation level,
4. Efficiency of collaboration within networks
5. Assumptions of analysing the network structure efficiency
- internal perspective – increase in the importance of knowledge as the key resource building company value resulted in the fact that the organisation itself started to be perceived as a dynamic and network structure in which the internal social relations between the employees, oriented at building, flow and use of knowledge, play a key role. The principal assumption underlying the relations in the network is that both parties to the exchange rely on resources controlled by the other party and both parties gain benefits from these various sources.
- external perspective – network organisation, also referred to as the strategic (cooperation) network or strategic relationships network, inter-organisational network or inter-firm network, is defined as the system of inter-organisational relations permitting the organisations to carry out a joint strategy which boost their total efficiency.
- the horizontal networks are built between enterprises which compete on the same market, these are e.g. groups of manufacturers supplying the same retail stores in the region,
- vertical, which pertain in particular to the development of supply systems, alliances between the enterprises belonging to different stages of task implementation in the same value chain.
- inter-institutional and inter-disciplinary relations inside the R&D works system,
- between scientists and engineers, usually within core technologies, such as biotechnology, electronics, new materials,
- between the existing and potential users of new products and technological processes,
- emerging in various company units, of considerable importance both for new product manufacturing and its marketing, i.e. between the design, R&D, manufacturing and marketing units,
- developing new knowledge and expertise for the company and its employees (own and competitors’ knowledge) and using external expertise (of suppliers, customers, vendors, advisers, universities and institutes).
- the elements of a business network may comprise companies, institutions in the business environment, R&D units and local governments,
- the relations may be formal (regulated by contracts or agreements) or informal (resulting from interpersonal contacts),
- the relations between the elements of the network are, primarily, cooperative – the mutual relations between the elements, in particular the division of activities and cooperation under a certain collective behaviour, not always formalised, secondly, the cooperation may be accompanied by competition between actors in the network (Easton 1992, s. 3-25):,
- the actors in the network share the feeling of identity separating them from entities outside the network,
- it is possible to identify similarities in the field of operation on which the network elements focus,
-
the network elements have a defined and shared goal they want to achieve through the network.
- Business networks may take on a form of clusters in line with the definition of M. E. Porter, or a cooperation network as defined by L. Palmen. They may be separate and formalised organisations, or operate without such separate and formal organisation. The cooperation networks and clusters correspond with the following organisational forms of business networks on the regional scale: cluster initiatives, local action or manufacturer groups.
- When researching the efficiency of business networks, the relations between the members of organisation are stressed. In particular, horizontal relations are indicated as such, which permit to join competences and use the available resources in the best possible way. The inter-organisational relations cover such interactions between the enterprises, which include information, material or energy exchange and which the parties are mutually committed to. The network structure results from the application of an approach based on dynamic relations, and:
- the key precondition of business network operation is the use of its resources by the members. At the same time, the focus is on the initiative and autonomy,
- the application of such a solution results most of all from the excessive formalisation of actions in relation to the changeability of the environment, and it is also related to the chaos in the environment, and an information gap which prevents efficient management,
- they facilitate flexibility of operation, self-organisation and increased involvement of employees, they also drive innovation.
- organisational relations – through companies holding ownership rights to other companies within the network, though, manning the management boards by the owners of the holding company etc.
- market relations – customer – supplier bond.
- regional relations – proximity of registered offices of companies, overlapping areas of operation.
- informal relations – family or political ties etc.
- When analysing the relations in networks, the following systems may be distinguished:
- systems of relations within the organisation,
- systems of relations between the enterprise, its suppliers and customers,
- systems between enterprises handling similar and complementary operations.
- the elements of a network of relations may comprise companies, institutions in the business environment, R&D units and local governments,
- the relations may be formal (regulated by contracts or agreements) or informal (resulting from interpersonal contacts),
- the relations between the elements of the network are, primarily, cooperative – the mutual relations between the elements, in particular the division of activities and cooperation under a certain collective behaviour, not always formalised, secondly, the cooperation may be accompanied by competition between actors in the network,
- the actors in the network share the feeling of identity separating them from entities outside the network,
- it is possible to identify similarities in the field of operation on which the network elements focus,
-
the network elements have a defined and shared goal they want to achieve through the network.
- The business network efficiency evaluation should be based on efficiency measures/criteria relating to the achievement of goals in the organisation as a whole, within a coherent efficiency system. The guidelines for the business network efficiency system include an imperative to apply universal measures of organisational efficiency. This means that the same measures should be applied throughout and should pertain to the same elements as the universal measures may be summed bottom-up and factorised top-down and then efficiency may be compared within the organisation. The wide approach to efficiency requires it to be considered in various dimensions and at various levels of aggregation, using both quantitative and qualitative criteria.
- At the level of the entire network it is important to evaluate the actual efficiency, which takes into consideration the mutual relations between business partners and synergy effects gained. On the other hand, at the level of individual enterprises contributing to the available resource base, it is important to determine the potential efficiency. The evaluation of potential efficiency should determine whether or not to accept an enterprise into the network, define its position in the mutual relations structure and initiate changes boosting the efficiency of the entire network structure.
- The efficiency of management processes in business networks should be evaluated while taking into consideration the processes of building and capturing value, based on the business model concept, compatible with the value management concept.
6. Methodology for assessing the efficiency business networks
Fig. 1. A general diagram of network structure efficiency analysis
Source: own study.
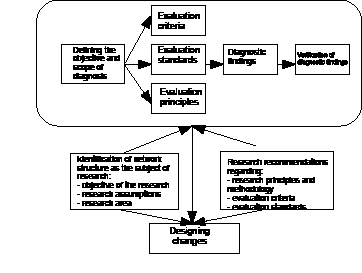
General diagram of research procedure
The research procedure cycle may be presented in the following stages:
I. Identification of network structures as subject of the research
- Defining the objective of the research and research assumptions
- Defining the research area
- Registration and development of object and process description
II. Network structure efficiency diagnosis
- Defining evaluation criteria,
- Development of evaluation standards
- Development of evaluation principles
- Nominative and verification assessment
- Diagnostic findings and causal analysis,
- comparative, dynamic and spatial studies.
- Defining grounds for changes;
- Identification of the type and scope of changes;
- Designing the system of objectives.
- the position of individuals in the structure,
- the isolation of groups within networks,
- the global properties of the entire network’s structure.
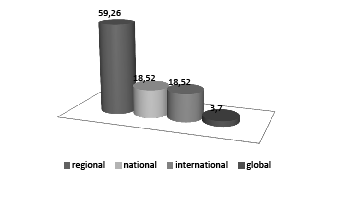
Fig. 2. Scope of working of surveyed clusters
Source: Author’s own study.
7. An example of assessing the efficiency of business networks
- aggregate assessment of business networks
- assessment of a structural aspect of surveyed business networks,
- identification of a scope of applying the idea of knowledge management in business networks,
- assessment of degree of fulfilling the function of knowledge management in surveyed networks,
- assessment of the innovation capacity of surveyed networks
- assessment of social aspect of functioning of the surveyed networks.
The research procedure of categorisation included the following phases:
- determination of assessment criteria,
- qualification of assessment criteria,
- conducting verifying assessment.
- mark of category of a surveyed cluster.
Assessment criteria of efficiency1 of surveyed cluster are presented in Table 1. A questionnaire was created on the basis of established criteria.
Table 2. Criteria used in assessing potential efficiency
|
Criterion |
Description |
|
Stability |
Ability to maintain a current position in case of internal disturbances. The stability of networks is usually provided by proper relationship management. Business trust and compliance with the principles of responsible business are particularly important factors here. These two spheres facilitate the adjustment of social relationships in networks, mitigating economic risk and determining comparative stability of organisations operating in temporary and dispersed market structures. From the point of view of network and virtual organisations, economic indicators and indicators regarding relationships with business partners are particularly important, but other values may also provide significant information about anticipated stability of collaboration. |
|
Adaptability |
Ability to adapt an organisation to changes in the environment. Adaptability depends, most of all, on available resources and the ability to reconfigure the existing resources or to acquire new ones. One of the methods of assessing the efficiency of resource management is the Multi-Attribute Resource Management Model developed by ARC Advisory Group. The model covers such areas of enterprise resource management as: resources and interaction levels on which the enterprise is focused, scope of actions taken as part of resource management, selected approach and technologies employed to enhance efficiency, resources used by the managing team, anticipated collaboration level and integration with the enterprise information systems, results achieved as part of resource management. |
|
Invention |
Ability to change the operation of an organisation in pursuance of an intentional change of the environment. Actions in this regard are taken mainly as part of knowledge and intellectual capital management processes. In this context four types of development processes supporting the enhancement of efficiency in network environment can be distinguished. |
Source: Own study based on (Dzidowski, 2011, p.91).
In second place the weights of assessment criteria were established (Table 4). Weights express the importance, relevance, materiality some factor (these are the measures used in a special way, because they are related to the evaluation criteria, which are the primary basis for evaluation). This step of the procedure is an essential factor in the evaluation of weighted objects, since it can not be done otherwise than by determining the preferences of the individual evaluation criteria. Weights are allocated to the particular assessment criteria based on the three-point scale. 3 points – dominant criteria, 2 points- basic criteria (required), 1 point – useful criteria.
Table 3. Assessment criteria of effectiveness of surveyed cluster
|
K1 - Calculation of productivity |
|
K2 - Objectives and tasks |
|
K3 - Stability (flexibility) |
|
K4 - Coordination |
|
K5 - Scale |
|
K6 - Diversity of resources |
|
K7 - Centralisation |
|
K8 - Density |
|
K9 - Formalization |
|
K10 - Sharing of expertise with cooperants |
|
K11 - Sharing of knowledge insider the middle of network |
|
K12 - Barriers in the sharing of knowledge ” |
|
K13 - Using of IT systems |
|
K14 - Corporate problem solving |
|
K15 - Inner commucation |
|
K16 - Investment business |
|
K17- Research-and- Development |
|
K18 - Involvement in society |
|
K19 - Observing the rules of corporate responsibility |
|
K20 - Development of worker’s potential |
Source: own study.
Then, the verifying assessment was conducted, where the normalized four-points assessment was provided. (Table 5) The verifying assessment is to indicate the extent to which the given subject respects established requirements. (given by the patterns of achievement assessment). Interpenetration of results and their tendency is the key issue in order to give an adequate verifying assessment, especially in the case of multicriteria model, in which individual criteria are of the stimulant, destimulant or nominant nature. The formula of verifying assessment is provided by the relation between actual fact and the master. The verifying assessment, which is defined in such manner, is a good appliance of normalization of assessment criteria., thanks to that the aggregate assessment is possible.
Table 4. Importance of the evaluation criteria
|
Criterion |
Weight |
|
K1 - Calculation of productivity |
3 |
|
K2 - Objectives and tasks |
3 |
|
K3 - Stability (flexibility) |
2 |
|
K4 - Coordination |
3 |
|
K5 - Scale |
1 |
|
K6 - Diversity of resources |
2 |
|
K7 - Centralisation |
2 |
|
K8 - Density |
2 |
|
K9 - Formalization |
2 |
|
K10 - Sharing of expertise with cooperants |
2 |
|
K11 - Sharing of knowledge insider the middle of network |
3 |
|
K12 - Barriers in the sharing of knowledge ” |
3 |
|
K13 - Using of IT systems |
3 |
|
K14 - Corporate problem solving |
2 |
|
K15 - Inner commucation |
2 |
|
K16 - Investment business |
3 |
|
K17- Research-and- Development |
1 |
|
K18 - Involvement in society |
2 |
|
K19 - Observing the rules of corporate responsibility |
2 |
|
K20 - Development of worker’s potential |
2 |
Source: own study
Table 5. Conversion table for the scoring of the examination
|
Assessment criteria |
Scoring |
||||
|
Insufficient condition 0 |
Admissible condition 1 |
Average condition 2 |
Good condition 3 |
Distinguishing condition 4 |
|
|
K1 |
0 |
0-1 |
1 |
<1 |
<1 |
|
K2 |
0 |
1 |
2 |
3 |
4 |
|
K3 |
0 |
1 |
2 |
3 |
4 |
|
K4 |
0 |
2-3 |
2-3 |
2-3 |
1,4 |
|
K5 |
0 |
2-3 |
2-3 |
2-3 |
1,4 |
|
K6 |
0 |
2-3 |
2-3 |
2-3 |
1,4 |
|
K7 |
0 |
0-1 |
0-1 |
0-1 |
1 |
|
K8 |
0 |
0-1 |
0-1 |
0-1 |
0,203 |
|
K9 |
0 |
1 |
2 |
3 |
4 |
|
K10 |
0 |
1 |
2 |
3 |
4 |
|
K11 |
0 |
1 |
2 |
3 |
4 |
|
K12 |
9-7 |
6-4 |
4-2 |
1 |
0 |
|
K13 |
0 |
1-2 |
3-4 |
5-6 |
7-8 |
|
K14 |
0 |
1 |
2 |
3 |
4 |
|
K15 |
0 |
1 |
2 |
3 |
4 |
|
K16 |
0 |
1 |
2 |
3 |
4 |
|
K17 |
0 |
1 |
2 |
3 |
4 |
|
K18 |
0 |
1 |
2 |
3 |
|
|
K19 |
0 |
1-2 |
3-4 |
4-5 |
6 |
|
K20 |
0 |
1-2 |
3-5 |
5-6 |
7 |
Source: own study.
Table 6. Hierarchical index ranges IE
|
Category |
Scoring |
|
E – network service of a high effectiveness index index value: IWI above 80% maximal value |
168-128 |
|
EA - network service of a satisfactory effectiveness of index index value IWI 61% - 80% of maximal value |
127 - 87 |
|
EB - network service of a average effectiveness of index index value IWI 40% - 60% maximal value |
86 - 46 |
|
EC - network service of a low effectiveness of index index value IWI from 40% maximal value |
0 - 45 |
Source: own study.
Table 7. Amount of distinguished clusters
|
Category |
Index value |
Amount of clusters |
|
E |
168-128 |
3 |
|
EA |
127-87 |
17 |
|
EB |
86-46 |
27 |
|
EC |
0-45 |
9 |
Source: own study.
A value of effectiveness index IE was determined for each surveyed network service according to the table,
![]() (1)
(1)
where :
wj – weight of the j assessment criterion,
qij– point verifying assessment,
I = 1, …, m – network service,
J= 1, …, n – assessment criteria.
The maximum weight value of effectiveness index amounts to 168. This amount would be reached by an company if it became a 4 grade for each of assessment criteria. In surveyed population of 56 network services the biggest phatic index value.
After calculating of the index , the clusters were qualified to the given categories. (table 7)
Among the surveyed clusters, three of them got E category. This is the cluster of a high index value. In this group can be found the IT companies . The biggest amount of clusters are found in EA(17) and EB(27) categories.
The studies are an example of the use of multi-criteria approach in assessing the efficiency of business networks. This approach reflects the complexity of economic relationships formed in them. In the presented study the business network efficiency evaluation is based on efficiency measures/criteria relating to the achievement of goals in the organisation as a whole, within a coherent efficiency system.
8. Conclusion
It should be stated that the efficiency assessment of network organisations needs a multi-level approach which reflects the complexity of economic relationships formed in them. The considerations discussed can lead to the following conclusions:
- at the level of the whole network it is important to assess its actual efficiency, considering mutual relationships between business partners and synergy effects produced; when it comes to the level of individual enterprises forming available resources it is important to determine potential efficiency,
- the potential efficiency assessment should decide whether a given enterprise is accepted into a network, determine its position in mutual relationships and initiate changes aiming at enhancing efficiency of the whole network,
- the efficiency of managerial processes of network organisations should be assessed through the processes of value creation and value capturing based on the business model concept, compatible with the concept of management through value,
- the efficiency assessment of network organisations should be referred to basic goals of network creation,
- the efficiency of network business models should be analysed on the basis of an approach which focuses on dynamic relationships in which, as the theory of games presumes, total gains and losses, owing to coopetition strategies applied by network members, exceeds zero,
- the aspects emphasised by the network-based approach include mutual trust and fulfilment of promises by partners, whereby they achieve long-term symbiotic benefits,
- empirical studies conducted by the author show, that the majority of respondents network presents the mean, or average level of efficiency. Among the clusters with the highest level of efficiency can be found in most networks active in the field of high technologies, mainly in the telecommunications industry.
Acknowledgements
The article was developed in the framework of the project entitled: Model assessment of efficiency of business networks. The project was funded by the National Science Centre allocated on the basis of the decision number DEC-2013/11/B/HS4/01030
1 The issue of criteria for assessing the efficiency of business networks widely article describes: Barczak B., Kryteria oceny efektywności struktur sieciowych, (in English: Evaluation Criteria of Network Structure Efficiency), in Ekonomika i Organizacja Przedsiębiorstwa, Orgmasz, Kraków, nr 2 (75, pp: 28-38, ISSN: 0860-6846, 2013.